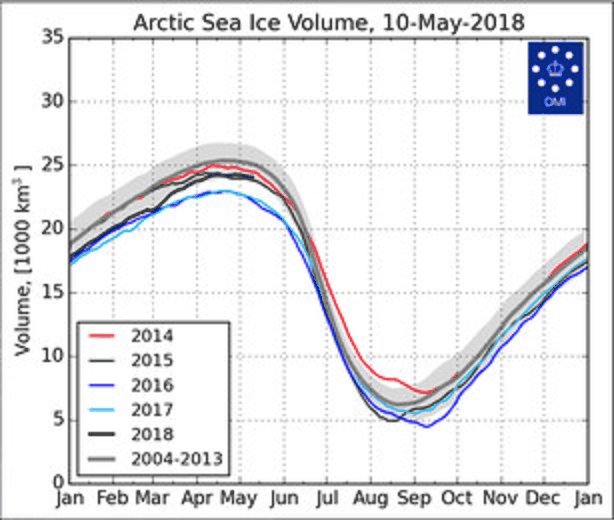
The climate alarmists with the media hanging on their coat tails have been bleating about a melting Arctic all winter long – just because we had a warm November (2017) and a warmish month in the early year (2018) but what is really happening out there in the Arctic where in spite of the so called warming spells it has remained under freezing point and in almost total darkness. Well, a Japanese sceptic blogger has provided a nice animation on Twitter showing the recent development from April 20th to May 10th and as one can see by pressing the play button there is about 200 cubic km (2 trillion cubic metres) more ice volume than there was a year earlier – and in 2016. In spite of the spurious larding of propaganda the usual suspects have been found out – big time.
 … go to http://notrickszone.com/2018/05/12/arctic-adds-amazing-2-trillion-200000… … for the genuine version of the graph (with animation). Where does all the ice come from when we consider Arctic surface air temperatures have been warmer for some of the winter? The answer is at the link to the German blog (notricks zone).