At https://notrickszone.com/2019/06/04/climate-scientists-astounded-no-arct… … data issued by the Danish Meteorological Institute shows that Arctic sea ice stopped shrinking 13 years ago, defying predictions made by climate scientists of the alarmist school and their models. Pierre Gosselin says this follows evidence he posted a few days ago that Antarctica's coastal stations showed cooling rather than warming – which was also a surprise to some people (but consistent with what other people have been saying for years). Is somebody telling porkies?
We are now in June when the Arctic melt season begins and over the last decade, Gosselin says, it can be shown that June levels of sea ice have grown – dipping in 2016 as a result of the last El Nino event. These have a delayed mechanism but drive warm water into the Arctic ocean via the Atlantic – and presumably via the Bering Straits.
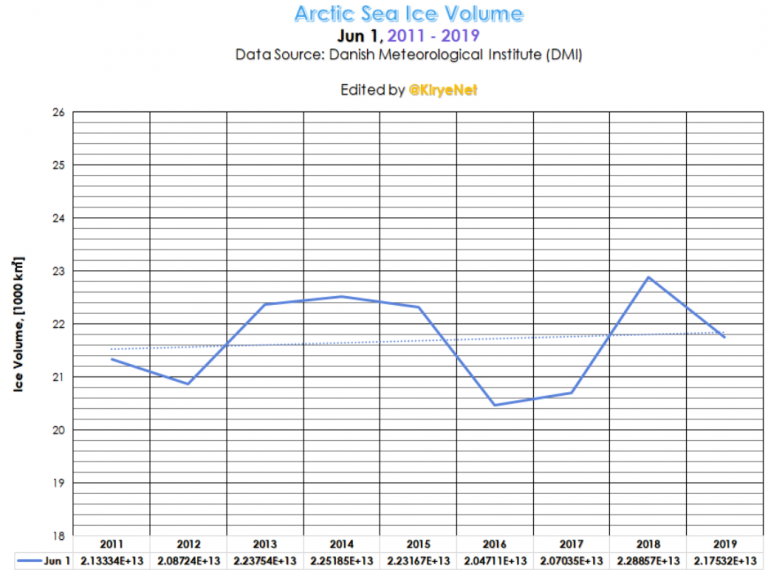 … but a word of caution as these kind of compilations can be very misleading. The graph is only of early June sea ice levels (and does not apply to July or August), and is restricted to 2011 to 2019. Climate scientists do this trick all the time in order to make their graphs resonate – choosing a start date when the climate was cool in order to show a bigger uptick than reality suggests. This is why a start date of 1850 is always used on long term graphs as that coincides with a deep drop in temperatures – or a certain decade around the turn of the 20th century which was cooler than average. In that sense the compiler of the graph above is no different from the climate scientists in only showing data that supports his or her view. A graph that showed a much longer period of sea ice levels in June would have clarified the situation better. One would expect a low in Arctic sea ice levels coinciding with the last El Nino in 2015 and sure enough we have one – in 2016 (which provides time for the ocean conveyor belt system to transfer warm water from the mid Pacific into the Arctic ocean. There are also other factors which affect sea ice – not least heavy storms that can drive the sea ice south and melt it quicker etc. The point of this graph though is that June is the start of the melt season and therefore if global warming was really going on the sea ice would have been melting earlier and earlier (but it quite clearly is not). That is all you need to take away from the graph. Now, if one is convinced sea ice in the Arctic is diminishing one also has to take onboard another fact of life and that is that during the winter the Arctic region is in darkness for months (and the sea ice grows back) while in the summer it is light for 24 hours, or nearly so, for months (which is when the ice melts as a result of continuous sunshine). The very idea that the Arctic sea ice will disappear was always nonsense – see for example https://realclimatescience.com/2019/06/experts-arctic-to-be-ice-free-by-… … and various other forecasts that have continued to tell this particular lie over the intervening years. The Arctic is not going to be ice free simply because the Sun is not providing any heat during the winter (and only in the summer months). Arguments based on geology (and trees growing in what are now Arctic regions) do not take into account continental drift or pole shift (and therefore assume the North Pole was always positioned over what is now the Arctic). In reality the climate scientists do realise this but studiously avoid mentioning it to Joe Public. The indoctrination will of course mostly fall on death ears but it clearly does impress some people who become activists provoked by an unnamed fear of a catastrophe on the way – which says more about the human psyche than it does about climate. Other people are quite happy to stoke the indoctrination (fueling it) as they see it as an ends to a mean (and others push the narrative because they are making shovel loads of money out of subsidies). HH Lamb (and his American counterpart) were early climate scientists (in the 20th century) and recorded low sea ice levels in summer months in the Arctic during the 1930s (which is rarely mentioned by modern computer driven climate scientists). The sea ice returned in the 1950s and 1960s and shrunk once again in the 1990s amd 2000s. HH Lamb also had recourse to Admiralty sea charts going back a couple of hundred years which also showed sea ice levels shrank and regained themselves on a number of occasions. This is usually explained as due to a 60 year solar cycle in which El Ninos dominate for 30 years and La Ninas dominate for the other 30 years. If this is true one can expect Arctic sea ice levels to continue to rise over the next couple of decades – and then begin to shrink again. We shall see.
Over at https://phys.org/news/2019-06-loss-arctic-sea-ice-stokes.html … we have another research paper that claims Arctic sea ice loss is a fact and it is causing heat waves in the southern half of the US. Here, the study conveniently ends in 2016 – during the dip in the graph from the Gosselin post. It ignores 2017 to 2019 and yet it has just been published. Why is that one may wonder – but the answer is of course self evident. It allows the idea of sea ice loss to continue to prosper and show up in their data even though it is not actually melting in the way implied. Gosselin has clearly also done the same thing so we would have to go elsewhere to get at the nub of the so called problem – and https://wattsupwiththat.com/reference-pages/sea-ice-page/ actually has a sea ice page which can be explored via various permutations. As can be seen the 2019 sea ice level is low for the time of year so what does that mean for Gosselin.